Solutions in Water Environment
for People and Planet

This sludge characterization data is taken from Environmental Science and Pollution Research volume 29, pages32397-32414 (2022), Indonesia.
印度尼西亚 With a population of 270 million, domestic wastewater is one of the main sources of wastewater from human activities in Indonesia.
The study found that the volume of grey water in Indonesia was 14 times higher than the volume of black water, and the volume of untreated grey water was 36 times higher than the volume of untreated black manure solids wastewater.
Graywater: refers to kitchen and bathroom drainage that is reused after purification and treatment, also known as graywater. It can be widely used for industrial and agricultural purposes, drinking water, etc. depending on the purity of the water after purifying dishes and laundry water discharged from households.
Key elements of concern include suspended solids, chemical oxygen demand (COD), biochemical oxygen demand (BOD), oils and fats, nitrogen, and coliform bacteria.
The analysis shows that the large volume of graywater and lack of treatment can be a significant source of water pollution.
Furthermore, domestic black water, which relies primarily on on-site treatment, is often inadequate due to a lack of quality control over facilities, operations, and maintenance.
Indonesia is in dire need of an environmental management law to establish and ensure wastewater treatment at the household, community, or city level.
Indonesia has about 153 million people living in urban areas and about 117 million people living in rural areas (BPS2021a).
In urban areas, the total volume, together with domestic wastewater (household, commercial, industrial) and non-stormwater flows, is estimated to be 14.3 km³/year, where the treatment capacity of the facility is only 0.3 km³/year.
We begin this review by providing an overview of the current status, characteristics, and treatment systems for domestic wastewater in Indonesia.
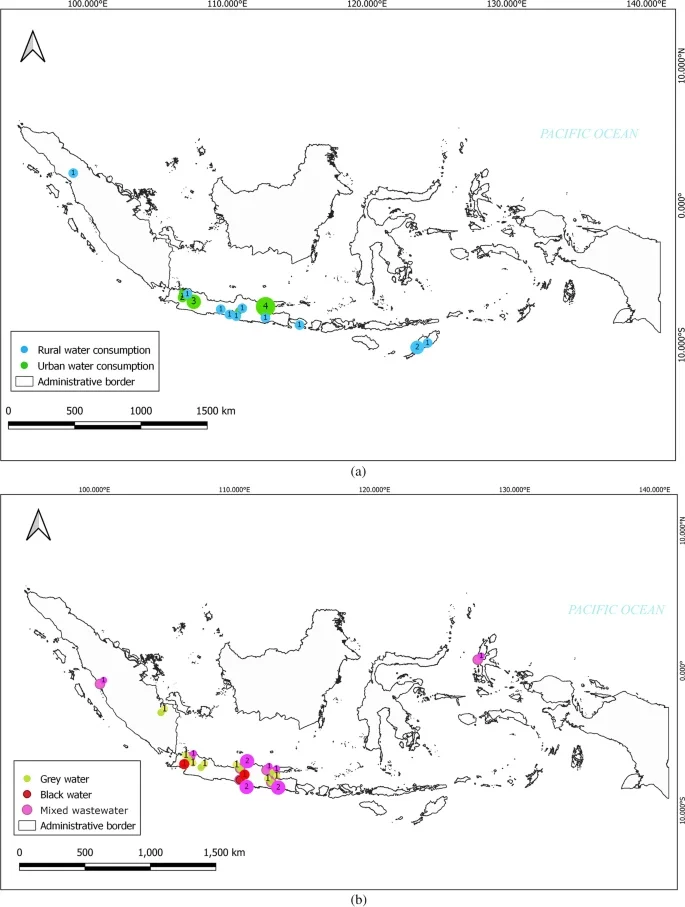
Illustration )
After using/screening the Indonesian Google literature from the last 10 years, 26 studies on domestic water consumption, 7 studies on domestic graywater, 11 studies on combined domestic graywater and septage wastewater, and 2 studies on septage wastewater were selected.
Supporting data was also collected from publications by the Food and Agriculture Organization (FAO), the Indonesian Ministry of Health (MoH), and the Indonesian Statistics Agency (BPS), and the spatial distribution of the results is shown in Figure 1.
The study was a one-time survey, and long-term studies are not included in this review.
| Parameter | Unit | WQSa | Weighted Life Count | Mixed (gray water + manure wastewater) | Manure Wastewater | |||||
|---|---|---|---|---|---|---|---|---|---|---|
| 印度尼西亚b | Thailandc | 印度尼西亚d | 马来西亚e | Thailandf | Singaporeg | Vietnamh | 印度尼西亚i | |||
| pH | -. | 6-9 | 6.5-8.6 (7.2 ± 0.8) | 7.2 ± 0.4 | 6.7-7.5 (7.1 ± 0.3) | 6.4 ± 0.4 | 6.7-7.4 (7.0) | 6.8-7.6 (7.2) | 8.2 | 6.2-7.4 (6.8 ± 0.8) |
| TSS | mg/l | 30 | 77-382 (189 ± 115) | 69 ± 31 | 25-1148 (462 ± 357) | 14 ± 3 | 15-243 (58) | 58-5900 (771) | 36 | 184-482 (333 ± 211) |
| TDS | mg/l | -. | 152-376 (264 ± 159) | 124-430 (256) | 652-840 (746 ± 133) | |||||
| BOD | mg/l | 30 | 125-401 (225 ± 96) | 90 ± 44 | 135-480 (271 ± 147) | 118 ± 14 | 12-52 (30) | 206-850 (528 ± 455) | ||
| COD | mg/l | 100 | 232-780 (418 ± 219) | 160 ± 64 | 148-472 (311 ± 144) | 234 ± 20 | 40-160 (100) | 100-4590 (809) | 116 | 509-2361 (1435 ± 1310) |
| BOD/COD | % | -. | 29-95 (57 ± 24) | 46-149 (89 ± 47) | 36-41 (38 ± 3) | |||||
| Oil and grease | mg/l | 5 | 24-87 (49 ± 33) | 2-163 (61 ± 89) | 5.3-29 (14) | 14 | ||||
| Ammonia (NH3-N) | mg/l | 10 | 0.7-20 (7.5 ± 8.6) | 0.1-259 (45 ± 87) | 12 ± 0.2 | 36 | 112 | |||
| Total nitrogen | mg/l | -. | 59-226 (142 ± 119) | 35-192 (113 ± 110) | 5-20 (10) | 19-653 (336 ± 448) | ||||
| Phosphate (PO43- Β-P) | mg/l | -. | 10-16 (13 ± 4) | 0.4-1.3 (0.8 ± 0.6) | 5.0 ± 0.2 | |||||
| Total phosphorus | mg/l | -. | 24 | 1.5 ± 0.9 | 3-12 (6 ± 5) | 6.2 | ||||
| Faecal coliform | MPN/100 ml | -. | 2.4 × 10³-1.2 × 10⁹ (4.0 ± 6.9 × 10⁸) | 9.3 × 10³-4.6 × 10⁶ (9.1 × 10⁵) | 9.8 × 10⁵ | |||||
| Total coliform | MPN/100 ml | 3000 | 2.6 × 10²-1.3 × 10⁴ (4.5 ± 7.3 × 10³) | 3.3 × 10⁴-2.1 × 10⁸ (3.2 × 10⁷) | ||||||
| MBAS | mg/l | -. | 0.2-22 (11 ± 11) | 5 ± 4.8 | 0.1 | |||||
Indonesia's mixed wastewater (domestic + septage) has similar values in Thailand, Malaysia, Singapore, and Vietnam.
We characterized graywater, mixed wastewater, and septage wastewater in Indonesia.
Key findings
Living water: 0.7-20 mg/l
Manure wastewater: 112 mg/l
Mixed wastewater: 0.1-259 mg/l
Average value: 45 mg/day
This is the same level as similar oils in Malaysia (12 mg/l) and Vietnam (36 mg/l).
Living water: 59-226 mg/l
Mixed wastewater: 35-192 mg/l
Manure wastewater: 112mg/l
It was inferred that the exceptionally high concentration of nitrogen in households contributed only 21 TP3T of the total nitrogen in domestic wastewater (Malisie et al.,2007). Nitrogen can come from soap or food residues (Ghaitidak and Yadav,2013).
Living water: 10-16mg/l
Mixed wastewater: 0.4-1.3 mg/l
Total phosphorus concentration
Living water: 24mg/l
Mixed wastewater: 3-12mg/l
Assumed heavy water: 2.4 x 10³ to 1.2 x 10⁹ MPN/100ml
Manure wastewater: 9.8 x 10⁵
Mixed Wastewater : 2.6 x 10² to 1.3 x 10⁴
| City | 印度a | Water consumptionb (l/c/d) | Domestic wastewaterc (m3/day) | Sewage Wastewater Treatment Capacity (m3/day)d | Supply rate | |
|---|---|---|---|---|---|---|
| Installed | Used | |||||
| Medan | 2,279,894 | 150 | 273,587 | 10,000 | 5,650 | 2.1 |
| Parapat | 180,694 | 105 | 15,178 | 2,000 | 115 | 0.8 |
| DKI Jakarta | 10,557,810 | 150 | 1,266,937 | 42,000 | 5,195 | 0.4 |
| Bandung | 1,263,916 | 150 | 151,670 | 80,835 | 49,769 | 33 |
| Cirebon | 333,303 | 105 | 27,997 | 20,547 | 9,667 | 35 |
| Yogyakarta | 431,939 | 105 | 36,283 | 15,500 | 14,260 | 39 |
| Surakarta | 517,887 | 135 | 55,932 | 9,504 | 6,325 | 11 |
| Denpasar | 463,400 | 105 | 38,926 | 51,000 | 35,000 | 90 |
| Batam | 1,196,396 | 150 | 143,568 | 2,852 | 150 | 0.1 |
| Banjarmasin | 708,606 | 135 | 76,529 | 12,000 | 3,480 | 4.5 |
| Balikpapan | 688,318 | 135 | 74,338 | 800 | 800 | 1.1 |
| Tangerang | 1,771,092 | 150 | 212,531 | 2,700 | 600 | 0.3 |
The process of collecting and treating wastewater from homes, residential neighborhoods, and communities at a central facility or plant.
| Study Year | Location | Number of units | Processing System | Emission concentration (mg/l) | Removal Efficiency (%) | References |
|---|---|---|---|---|---|---|
| 2011 | Sleman, Yogyakarta, Surakarta, Blitar | 9 | abr-af (5), ad-abr-af (3), as (1) | BOD: 30-50COD: 80-131TSS: 22-44Ammonia: 35-57Total nitrogen: 59-88 | NA | (Kerstens et al. 2012) |
| 2011 | Yogyakarta | 2 | rbc (1), ca (1) | BOD: 7.5-88 (36)COD: 14-134 (62)TSS: 8-37 (19)Ammonia: 0-1.4 (0.6)Total nitrogen: 173-211 (216) | bod: 64-96 (81)cod: 76-95 (86)tss: 85-97 (91) | (Lim et al. 2013) |
| 2016 | Semarang | 6 | ABR + AF (6) | COD: 15-92 (41)TSS: 8-78 (32)Ammonia: 0.01-0.8 (0.4) | cod: 62-93 (85)tss: 80-95 (87) | (Astika and Zaman 2017) |
| 2018 | Yogyakarta | 9 | abr (8), rbc (1) | BOD: 12-105 (62)COD: 123-375 (242)TSS: 17-483 (193)Ammonia: 3-38 (20) | BOD: 23-97 (68)COD: 8-77 (52)TSS: 28-79 (53)Ammonia: 3-30 (12) | (Rahmawati et al. 2019) |
| 2018 | Malang | 89 | ABR (89) | BOD: 67 | BOD: 74TSS: 66Ammonia: 43 | (Yulistyorini et al. 2019a) |
| NA | Yogyakarta | 1 | AD + ABR (1) | BOD: 22COD: 61TSS: 60Total nitrogen: 4.7 | BOD: 88COD: 97TSS: 97Total nitrogen: 75 | (Rochmadi et al. 2010) |
| NA | Padang | 5 | ABR (5) | BOD: 29-207 (83)COD: 5-106 (18)TSS: 80-724 (128)Ammonia: 46-112 (76) | BOD: 10-72 (24)COD: 45-91 (85)TSS: 17-71 (58)Ammonia: 35-83 (69) | (Nur and Komala 2021) |
A decentralized wastewater treatment plant is a facility that treats wastewater from a small area or individual homes, as opposed to a centralized system. They typically use biological, physical, and chemical processes to remove contaminants and treat wastewater in a safe manner.
The current status of water purification plants in Indonesia and the entry of domestic companies : View